NOTICE: THIS IS NOT A REQUIRED ASSIGNMENT FOR BIO128/ENV1100.
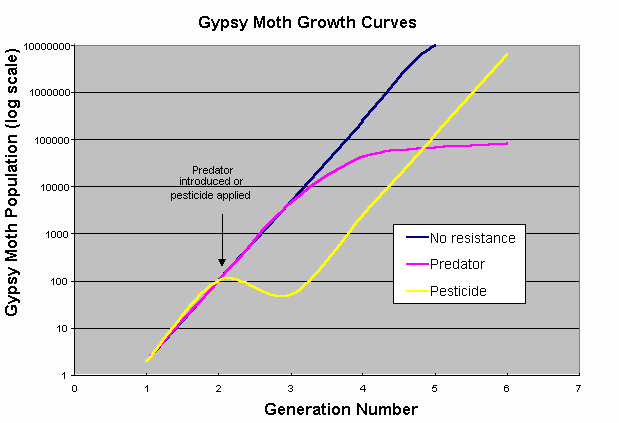
Using semilog paper, plot the population growth for the Gypsy Moth over six generations. Assume the following: Each generation every female lays 1000 eggs. In the absence of predators, ten percent of the eggs are recruited, that is, they grow to breeding age for the next generation. The recruited individuals are 50% female. If there are predators present, the recruitment rate is given by the formula:
RR = (0.001*P + 10)/(P + 100) with P equal to the number of predators.
To produce the graph, make a table including columns for generation (1 through 6), number of moths (2 for first generation, offspring times recruitment rate for each subsequent generation), number of females (1 for the first year, half of the number of moths for generation 2 through 6), number of offspring (1000 times the number of females), and number recruited (10% of the offspring unless there are pesticides or predators). In the popup, there are sample tables for you to fill in the blanks (or just look at my numbers below).
Plot generation on x-axis and population on the log-scale y-axis. The maximum adult population that can be supported by the local food supply in our model is 10 million individuals. So, if the number of recruited individuals comes out over 10 million, use a value of 10 million instead.
Anything over 1 million adults is considered to be too many. As you will see, the population quickly grows above one million. Is there anything we can do to reduce these numbers?
A chemical pesticide is a density-independent mortality factor. It would have the effect of reducing the proportion of recruited individuals in one generation only. Repeat the graph with pesticide application in the second generation reducing the recruitment to 0.1% instead of 10%.
An introduced predator is a density dependent factor since the number of gypsy moths would determine the level of predators. The predator would exert a continuing effect over many generations. The effect of a predator is to decrease the level of recruitment. To simulate this effect, start with 10 predators in the second generation. The recruitment rate for this generation would then be:
RR = (0.001*P + 10)/(P + 100) = (0.001*10 + 10)/(P + 100)
= 0.091 = 9.1 %
For each subsequent generation, the number of predators can be set at 10 percent of the number of adult moths.
I have entered these calculations into a spreadsheet, gypsy.xls.
|
NO PREDATOR, NO PESTICIDE |
||||||
|
Genera-tion number |
# of gypsy moths |
# of preda-tors |
# of female moths |
# of offspring |
# re- cruited |
recruit- ment factor |
|
1 |
2 |
0 |
1 |
1000 |
100 |
10% |
|
2 |
100 |
0 |
50 |
50000 |
5000 |
10% |
|
3 |
5000 |
0 |
2500 |
2500000 |
250000 |
10% |
|
4 |
250000 |
0 |
125000 |
125000000 |
10000000 |
10% |
|
5 |
10000000 |
0 |
5000000 |
5000000000 |
10000000 |
10% |
|
6 |
10000000 |
0 |
5000000 |
5000000000 |
10000000 |
10% |
|
PREDATOR INTRODUCED IN GENERATION 2 |
||||||
|
Genera-tion number |
# of gypsy moths |
# of preda-tors |
# of female moths |
# of offspring |
# recruited |
recruit- ment factor |
|
1 |
2 |
0 |
1 |
1000 |
100 |
10.00% |
|
2 |
100 |
10 |
50 |
50000 |
4550 |
9.10% |
|
3 |
4550 |
455 |
2275 |
2275000 |
42856 |
1.88% |
|
4 |
42856 |
4286 |
21428 |
21428041 |
69799 |
0.33% |
|
5 |
69799 |
6980 |
34900 |
34899674 |
83701 |
0.24% |
|
6 |
83701 |
8370 |
41850 |
41850258 |
90766 |
0.22% |
|
PESTICIDE APPLIED IN GENERATION 2 |
||||||
|
Genera-tion number |
# of gypsy moths |
# of preda-tors |
# of female moths |
# of offspring |
# recruited |
recruit- ment factor |
|
1 |
2 |
0 |
1 |
1000 |
100 |
10% |
|
2 |
100 |
0 |
50 |
50000 |
50 |
0.10% |
|
3 |
50 |
0 |
25 |
25000 |
2500 |
10% |
|
4 |
2500 |
0 |
1250 |
1250000 |
125000 |
10% |
|
5 |
125000 |
0 |
62500 |
62500000 |
6250000 |
10% |
|
6 |
6250000 |
0 |
3125000 |
3125000000 |
10000000 |
10% |
Anthony G Benoit
abenoit@trcc.commnet.edu
(860) 885-2386
Revised