- fish need 4 to 5 mg/L to survive
- under anaerobic conditions, undesirable (smelly) microbes can take over
- many factors affect the DO level
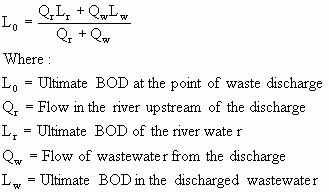
- At the outfall, BOD of the river/wastewater mixture (L0) is given by:
- Note: We found this formula earlier when we used a mass balance model for mixing
- This BOD is comparable to what we have in our stoppered bottle at the beginning of our BOD test
- As time passes (ie, the water moves downstream) the oxygen content of the river water is consumed in just the same way oxygen is consumed in the test
- Remember that BOD (Lt) in a test bottle at time t is given by:
- This formula holds in the river too (kD is the deoxygenation constant that we previously just called k; it can be adjusted for temperature using kT = k20q T-20)
- If we know an average velocity of flow, we can calculate the BOD for a given distance downstream
Lt = L0e-kDt
- The rate of reaeration, rR, is given by:
rR = -kR*D with
kR = reaeration time constant
D = DO deficit = DOs-DO
- The reaeration time constant can be estimated from Table 3-2, or calculated by:
kR,20°C = 3.9u1/2/H3/2
u = average stream velocity
H = average stream depth
|
Table 3-2 Reaeration constants |
|
|
Water body |
Ranges of kR at 20°C, |
|
Small ponds and backwaters |
0.1-0:23 |
|
Sluggish streams and large lakes |
0.23-0.35 |
|
Large streams of low velocity |
0.35-0.46 |
|
Large streams of normal velocity |
0.46-0.69 |
|
Swift streams |
0.69-1.15 |
|
Rapids and waterfalls |
Greater than 1.15 |
|
Source: Peavy, Rowe and Tchobanoglous, 1985 |
|
- To start with, the waste has some oxygen deficit which causes an initial DO deficit in the stream
- Water can only hold so much oxygen (DOsat), depending on the the water temperature
- Calculate the initial dissolved oxygen (DO0) using the same formula we used for L0 above
- Subtracting that from the initial DOsat:
rate of deficit increase = rate of deoxygenation - rate of reaeration
- This gives us a differential equation with the solution:
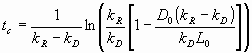
- This is the Streeter-Phelps oxygen-sag curve formula
- Note that for a constant stream cross-section, t=x/u (with u=stream velocity); therefore:
- If we want to plot DO versus distance downstream (that’s what I’m used to seeing) we need to subtract D from Ds at each point


- As long as this occurs, the DO of the stream will continue to drop
- Since the BOD is decreasing as time goes on, at some point, the rate of deoxygenation decreases to just the rate of reaearation
- At this point (called the critical point) the DO reaches a minimum
- Downstream of the critical point, reaeration occurs faster than deoxygenation, so the DO increases
- Using calculus and the Streeter-Phelps equation we get: